
Rate Conversion, Effective Rates & EAC
- #financial-management
- #effective-interest-rate
- #rate-conversion
- #equivalent-annual-cost
- #profitability-index
Rate Conversion, Effective Rates & EAC
Part of: Financial Management Lesson 3 — Financial Management & Finance Key concepts: Effective Interest Rate, Stated Rate, Rate Conversion, Profitability Index, Equivalent Annual Cost
The core problem: rates only mean something with a frequency
"12% per year" is ambiguous until you know how often it compounds. 1% per month is not 12% per year, because the monthly interest itself earns interest. This lesson is about converting rates between frequencies correctly and using the right one in every formula.
Two different conversions — don't confuse them
- Effective-to-effective (true compounding): convert a real per-period rate to another period using powers. Used when you already have a genuine effective rate.
- Stated-to-effective (APR → EAR): a Stated Rate (APR) is quoted annually but applied times a year by simple division. Convert with the formula.
1. Effective-rate conversions
If is the true effective rate over a period, the equivalent rate over a fraction/multiple of that period uses the geometric relationship — money compounds, it doesn't add:
6% effective annual → shorter periods
Period Semi-annual 2 2.956% Quarterly 4 1.467% Monthly 12 0.4868% Daily 365 0.01597% Note these are below — because compounding the smaller rate times must land back at exactly 6%.
Common mistakeDo not divide an effective annual rate by 12 to get a monthly rate. monthly compounds to , not 6%. Division only applies to stated rates (next section).
2. Stated (APR) vs Effective (EAR)
A loan quoted at "6% annual, compounded monthly" means the bank charges per month. The true annual cost is:
As compounding gets more frequent () the EAR approaches the continuous limit:
Stated 6% under different frequencies
Compounded EAR Annually 1 6.000% Semi-annually 2 6.090% Quarterly 4 6.136% Monthly 12 6.168% Daily 365 6.183% Continuously ∞ 6.184% Excel:
EFFECT(stated, m)gives the EAR;NOMINAL(eff, m)reverses it.
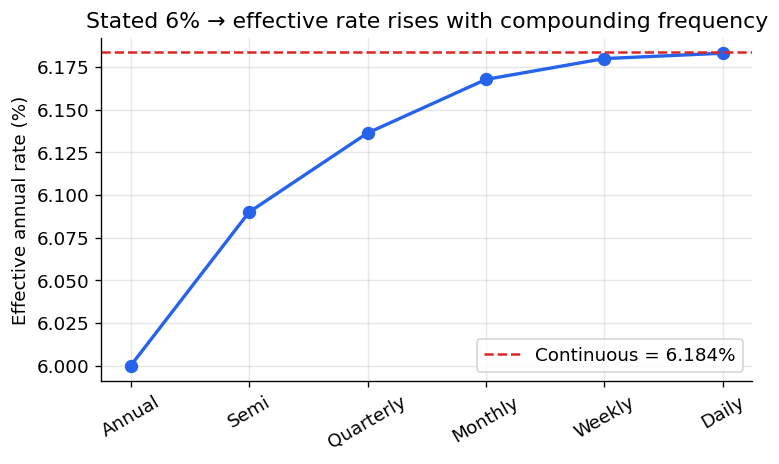
Why the curve flattensEach extra compounding step adds interest-on-interest, but the marginal benefit shrinks — going annual→monthly adds 0.17%, but monthly→continuous adds only 0.016%. The effective rate is bounded above by the continuous case .
3. Profitability Index & capital rationing
When you can't fund every positive-NPV project (a budget constraint), rank by bang-for-buck, not by raw NPV.
Decision procedure under a budget
- Compute PI for every project.
- Rank highest PI first.
- "Spend down" the budget greedily; the last project may be funded fractionally if it's divisible.
If projects were mutually exclusive instead, you'd simply pick the single highest-NPV project — PI is specifically for squeezing the most value out of a limited budget across several projects.
4. Equivalent Annual Cost / Annuity (EAC / EAV)
How do you compare projects (or machines) with different lifespans? Convert each one's NPV into the level annual cash flow it is equivalent to — then compare those annual figures on a like-for-like basis.
Equivalently, in Excel.
Renewable projects of unequal lengthProject A: over 2 years, NPV at → . Project B: now, in year 6, NPV → . Although B has the higher NPV, A delivers more per year () — for an indefinitely repeatable project, A is better. Comparing raw NPVs of different-length projects would be apples-to-oranges.
When to reach for EACUse EAC whenever the alternatives repeat or have different horizons (machine replacement, lease vs buy, recurring projects). It annualises away the horizon difference.
Summary
| Tool | Formula | Use when |
|---|---|---|
| Effective conversion | converting a true rate across periods | |
| APR → EAR | a stated rate applied ×/year | |
| Continuous limit | compounding "all the time" | |
| Profitability index | budget constraint, divisible projects | |
| Equivalent annual cost | annuity factor | different lifespans / repeating projects |
The one trap to rememberDivide stated rates by ; compound effective rates with powers. Mixing the two is the single most common error in this course.
Related Notes
- Lesson_01-Time Value of Money — annuity factor used in EAC
- Lesson_02-Perpetuities, NPV & IRR — NPV that feeds PI and EAC
- Lesson_04-Inflation, Real Rates & Expected Inflation — another real/nominal rate conversion
- HW_03-Profitability Index & EAC and HW_04-Effective Interest Rates — problem sets
- Financial Management — subject hub