
Machine FCF & NPV, CAPM, Bond Repricing, Loan Effective Rate, NPV vs IRR & EAC (2020 Moed A)
- #financial-management
- #fundamentals-of-finance
- #past-paper
- #reconstructed
- #free-cash-flow
- #capm
- #bond-pricing
- #effective-interest-rate
- #npv-irr
- #eac
Machine FCF & NPV, CAPM, Bond Repricing, Loan Effective Rate, NPV vs IRR & EAC (2020 Moed A)
Part of: Financial Management Financial Management & Finance, Moed A (2020). Open-ended calculation questions. Builds on: Lesson_06-Capital Budgeting & Free Cash Flow, Lesson_02-Perpetuities, NPV & IRR, Lesson_03-Rate Conversion, Effective Rates & EAC, Lesson_07-Bond Pricing Practice: HW_07-Free Cash Flow & Project NPV, HW_02-NPV, IRR & Project Choice, HW_03-Profitability Index & EAC, HW_04-Effective Interest Rates, HW_08-Bond Pricing, HW_09-Risk, Return & Diversification
Whole paper reconstructed, no official keyThe question paper is not on disk. The only source is a student's Excel workbook (
2020A.xlsx) whose cells hold short labels, inputs and formulas, never question text. Every question below is reconstructed from those inputs. The answers come from that student workbook, re-derived here, not from the lecturer. Check every question wording against the real paper.
AI-solved questionsEvery question in this note (Q1, Q2, S2, S4, S7, S10) is AI-written, not official. Where the workbook has a final answer I re-derived it and agree with it; Q2 has no answer cells in the workbook, so it is solved from scratch.
How the questions are numbered
The workbook has six sheets: Q1, Q2, 2, 4, 7, 10. Sheet 2 (a bond) and sheet Q2 (CAPM) cannot both be "question 2" of one numbering. The likeliest reading is two groups: Q1 and Q2 are the two long open questions, and 2, 4, 7, 10 are short numbered questions from a separate series (numbers 1 to 10 or so, where the student only worked the calculation ones). I could not prove that, so the headings use the sheet names: Q1, Q2, and S2, S4, S7, S10 for the sheets named 2, 4, 7, 10. These are not confirmed question numbers.
What this paper tests
| Id | Core idea | Where it is taught |
|---|---|---|
| Q1 | Free Cash Flow of a 20-year machine project: tax loss in year 1, depreciation tax shield, non-deductible expense, Working Capital, sale of the machine, then Net Present Value | Lesson_06-Capital Budgeting & Free Cash Flow, HW_07-Free Cash Flow & Project NPV |
| Q2 | CAPM: back out the risk-free rate and market return from two assets, then correlation and risk split | Cheat sheet (SML, beta), HW_09-Risk, Return & Diversification |
| S2 | Bond price when the market rate falls from 10% to 7% | Lesson_07-Bond Pricing, HW_08-Bond Pricing |
| S4 | Effective Interest Rate of a loan with fees: solve for the IRR of the borrower's cash flows | Lesson_03-Rate Conversion, Effective Rates & EAC, HW_04-Effective Interest Rates |
| S7 | Net Present Value and Internal Rate of Return of two projects at a high discount rate | Lesson_02-Perpetuities, NPV & IRR, HW_02-NPV, IRR & Project Choice |
| S10 | Two machines with different lives: Free Cash Flow, NPV, then Equivalent Annual Cost | Lesson_03-Rate Conversion, Effective Rates & EAC, HW_03-Profitability Index & EAC |
Intuition: the one move behind each question
- Q1 and S10: build a year-by-year table (EBIT, tax, NOPAT, add back depreciation, capex, working capital), then discount.
- Q2: two assets on the same line pin down the line (two equations, two unknowns).
- S2 and S4: a price or a rate is just a PV equation. Write the timeline, then solve for the unknown.
- S7 and S10: NPV tells you whether to do a project; compare unequal lives with the annuity-equivalent, not raw NPV.
Q1 — Machine project: free cash flow and NPV
Reconstructed question: the question paper is not on disk. This wording was inferred from the worked spreadsheet; check it against the real paper.
A company considers buying a machine for 1,700 at time 0 and running a project for 20 years. The cost of capital is 12% and the tax rate is 25%. Operating items (all per year unless stated):
| Item | Amount | Years |
|---|---|---|
| Revenue | 800 | 1 to 20 |
| Maintenance | 150 | 1 to 20 |
| Salaries | 300 | 1 to 20 |
| Marketing | 500 | year 1 only |
| Telephone and travel | 130 | 1 to 5 (tax deductible), 6 to 20 (not tax deductible, as the sheet treats it) |
| Legal fees | 50 | year 20 only |
| Depreciation (machine) | 200 | 1 to 8 |
Working capital of 160 is needed at time 0 and a further 13 in year 1; all 173 is recovered in year 20. The machine is sold in year 20 for 148. Losses give an immediate tax saving. Units are not stated (likely thousands).
Find the free cash flow for each year, the project NPV, and decide whether to accept.
AI-written answer, not official. Check before relying on it.The workbook gives NPV = -821.80. I rebuilt the table independently and get the same figure.
a. Free cash flow by year
Method (see Lesson_06-Capital Budgeting & Free Cash Flow):
The depreciation of 200 for 8 years totals 1,600, so the machine's book value at year 8 is 1,700 - 1,600 = 100.
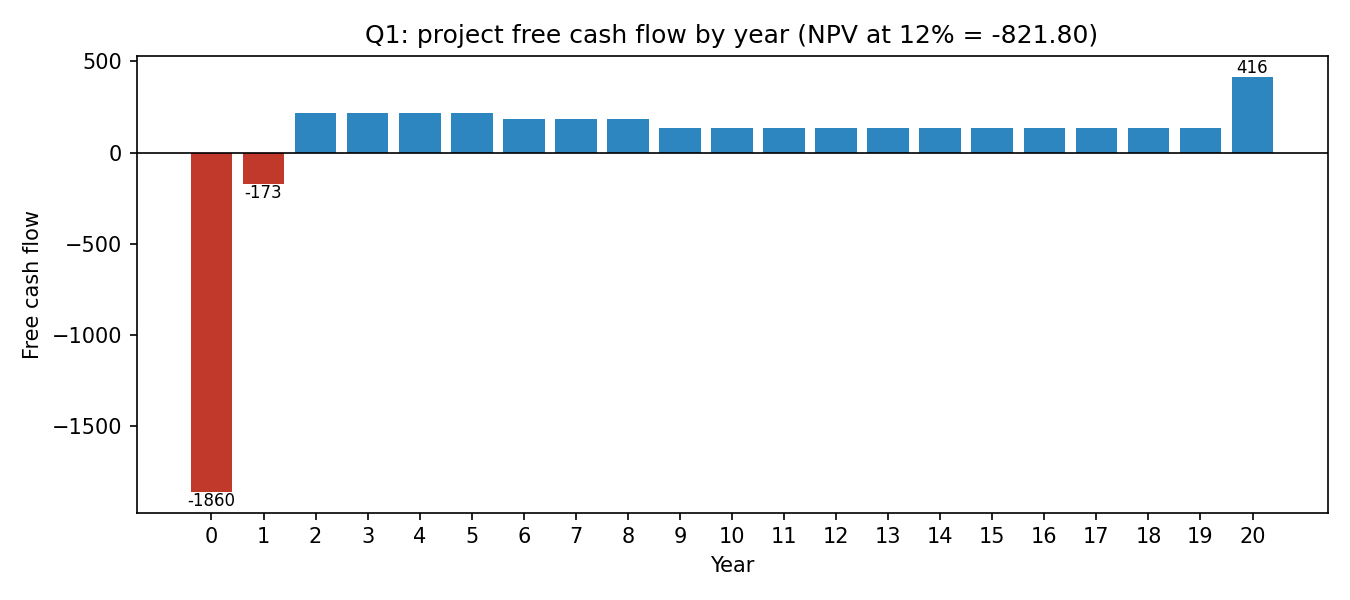
| Year | EBIT | Tax at 25% | NOPAT | Add back Dep | Other | FCF |
|---|---|---|---|---|---|---|
| 0 | n/a | n/a | n/a | n/a | machine -1,700, WC -160 | -1,860 |
| 1 | -480 | +120 | -360 | +200 | WC -13 | -173 |
| 2 to 5 | 20 | -5 | 15 | +200 | none | 215 |
| 6 to 8 | 150 | -37.5 | 112.5 | +200 | tel+travel -130 | 182.5 |
| 9 to 19 | 350 | -87.5 | 262.5 | 0 | tel+travel -130 | 132.5 |
| 20 | 300 | -75 | 225 | 0 | tel+travel -130, sale +148, WC +173 | 416 |
How each EBIT arises:
- Year 1: . A loss gives a tax saving of (symmetric tax, as in the lesson), so NOPAT is -360.
- Years 2 to 5: .
- Years 6 to 8: telephone and travel moves below the tax line, so EBIT is , and the 130 is subtracted after tax.
- Years 9 to 19: no depreciation left, EBIT .
- Year 20: EBIT (legal fees) .
Treatments the sheet chose (the real paper's wording decides)
- Telephone and travel in years 6 to 20 is taken after tax (treated as a non-deductible expense, the "undeductible expenses" row of the cheat-sheet table). The sheet also lists it as a deductible 130 in years 1 to 5.
- The sale price 148 is added with no capital-gains tax, although it exceeds the book value of 100. If the 48 gain were taxed at 25% (tax 12) the NPV would fall by ; at the course's 20% rate (tax 9.6) by 1.00.
b. NPV and decision
In Excel (time 0 sits outside the NPV function):
=NPV(12%, C20:V20) + B20 // = -821.80
AnswerNPV at 12%. Reject the project.
The undiscounted flows sum to +1,248, yet the NPV is negative: most of the cash arrives years later (about 133 a year from year 9) while 1,860 is paid up front. The IRR is about 4.96%, below the 12% cost of capital, which agrees.
IntuitionAnything that moves cash toward the present helps. Making the year 6 to 20 telephone costs deductible would add about to the NPV (still negative at about -696), and taxing the sale would take off 1 to 1.2. Neither choice flips the decision.
Q2 — CAPM: risk-free rate, market return and risk split
Reconstructed question: the question paper is not on disk. This wording was inferred from the worked spreadsheet; check it against the real paper.
The following assets are priced by the CAPM:
| Expected return | Standard deviation | Beta | |
|---|---|---|---|
| Asset A | 14.5% | 50% | 1.25 |
| Asset B | 7% | 30% | 0.5 |
| Market | not given | 40% | 1 |
| Risk-free asset | not given | 0 | 0 |
a. Find the risk-free rate and the expected market return. b. Find the correlation of each asset with the market. c. For each asset, split total risk into systematic and specific (diversifiable) risk.
Parts b and c are my guess at the intended follow-ups: the sheet gives the standard deviations of A, B and the market, which only matter for those. Part a needs only the expected returns and betas. The workbook has no answer cells for any part.
AI-written answer, not official. Check before relying on it.
a. Risk-free rate and market return
The SML (cheat sheet): . Write one equation per asset, with :
Subtract the second from the first: , so . Then and .
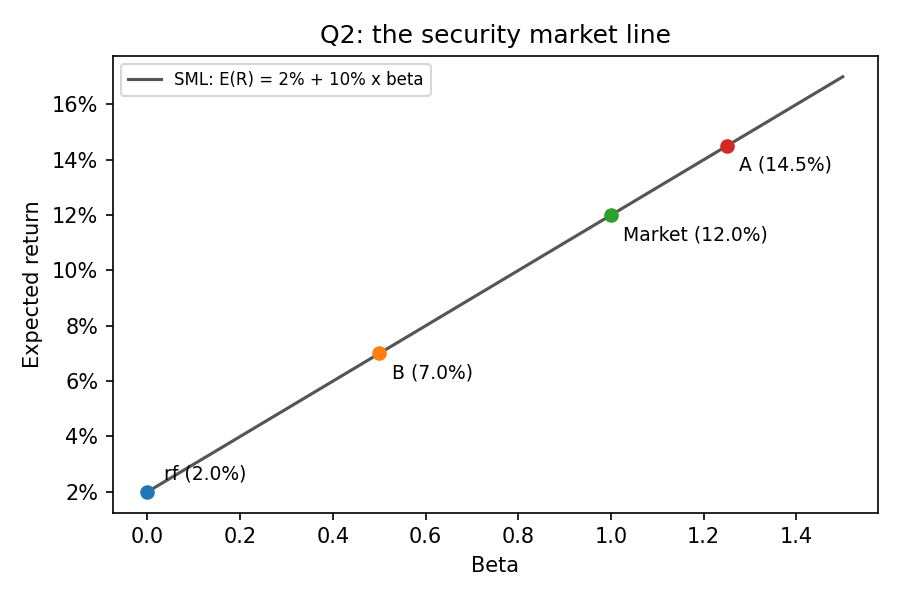
Answer a, (market risk premium 10%).
Check: A gives , B gives . Both lie on the line by construction.
b. Correlation with the market
From we get :
Answer b(A moves perfectly with the market) and .
c. Systematic and specific risk
Systematic variance is and specific variance is total minus systematic.
| Total variance | Systematic | Specific | Share systematic | |
|---|---|---|---|---|
| A | 0 | 100% | ||
| B | (SD about 22.4%) | 44.4% |
IntuitionA is a perfect market tracker (correlation 1) levered up by 1.25 in risk, so none of its risk can be diversified away. B carries more than half of its risk as asset-specific noise, which diversification removes and the market does not pay for.
S2 — Bond: price when the market rate falls
Reconstructed question: the question paper is not on disk. This wording was inferred from the worked spreadsheet; check it against the real paper.
A bond has face value 100,000, pays an annual coupon of 8%, and has 6 years to maturity. The market rate (YTM) is 10%, then falls to 7%. a. Find the price at 10%. b. Find the price at 7%. c. What is the percentage price change?
The sheet's labels ("og r" 10%, "new r" 7%, "C" = 8% of face) support this reading. The exact timing of the change is not in the sheet (see the tip at the end).
AI-written answer, not official. Check before relying on it.The workbook shows both prices, 91,289.48 and 104,766.54; I re-derived each.
Setup. Coupon for years 1 to 6, plus 100,000 in year 6 (cash flows 8,000, 8,000, 8,000, 8,000, 8,000, 108,000):
a. Price at 10%
Excel: =-PV(10%,6,8000,100000), or the sheet's =NPV(10%,C11:H11).
b. Price at 7%
Excel: =-PV(7%,6,8000,100000). The sheet discounts each flow separately at 7% (7,476.64 + 6,987.51 + 6,530.38 + 6,103.16 + 5,703.89 + 71,964.96) and sums them.
c. Percentage change
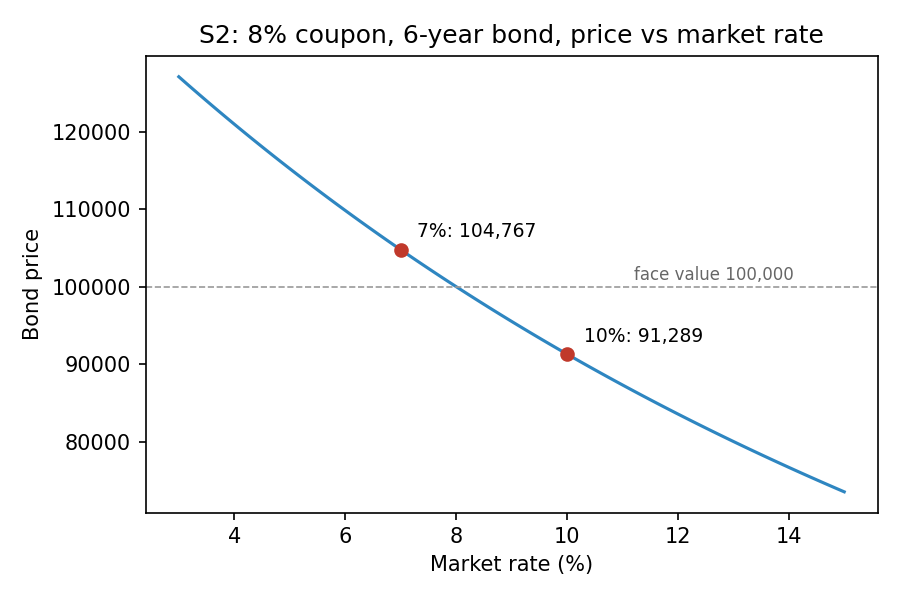
AnswerPrice at 10%: 91,289.48 (a discount bond, coupon 8% < YTM 10%). Price at 7%: 104,766.54 (a premium bond, coupon 8% > YTM 7%). The price rises about 14.76%.
Intuition and a possible variantRates and bond prices move in opposite directions: the lower rate raises the PV of the fixed coupons. The sheet also has an empty label "PV(T=1, r=7%)". If the rate had fallen only after the first coupon, the price at time 1 (right after that coupon) would be , and the first-year return from buying at 91,289.48 would be . This is my reading of the unfilled label, not a confirmed part of the question.
S4 — Loan with fees: effective rate
Reconstructed question: the question paper is not on disk. This wording was inferred from the worked spreadsheet; check it against the real paper.
A company borrows 50,000 for 10 months. The loan accrues interest at 12% a year, compounded monthly (1% a month). Principal and accrued interest are repaid together at the end of month 10. A processing fee of 1,000 is paid at the start, and a further fee of 1,200 is paid at the end. Find the effective monthly and effective annual interest rate the company really pays.
Input missing from sourceThe 1,200 at month 10 is a hard-coded number in the sheet with no label other than "Fees". Its purpose (a closing fee? an early-repayment fee?) is not stated. The compounding convention is inferred from the formula
(1+12%/12)^10.
AI-written answer, not official. Check before relying on it.The workbook stops at the monthly IRR (1.42%). I re-derived it and added the annual figure.
Interest accrued. .
Borrower's timeline (the company receives the loan net of the fee, then pays everything back):
| Month | 0 | 1 to 9 | 10 |
|---|---|---|---|
| Principal | +50,000 | 0 | -50,000 |
| Interest | 0 | 0 | -5,231.11 |
| Fees | -1,000 | 0 | -1,200 |
| Net cash flow | +49,000 | 0 | -56,431.11 |
Only two flows are non-zero, so the effective monthly rate has a closed form:
Excel: =IRR(B9:L9) (the sheet) or =RATE(10,0,49000,-56431.11); both give 1.4220%.
Convert to an annual effective rate (see Lesson_03-Rate Conversion, Effective Rates & EAC):
AnswerEffective monthly rate about 1.422%; effective annual rate about 18.46% (versus the stated 12% a year, whose own EAR is ).
What drives the gapFees on top of the stated rate raise the cost from 12.68% to 18.46% a year. Without the final 1,200 the monthly rate would be 1.204% (EAR 15.45%). The sheet also holds an unrelated scratch cell
=PMT(5%,10,150000)= -19,425.69 (a 150,000 loan at 5% over 10 periods) that does not connect to this question; I ignored it.
S7 — NPV vs IRR: two projects at a 40% rate
Reconstructed question: the question paper is not on disk. This wording was inferred from the worked spreadsheet; check it against the real paper.
The discount rate is r = 40%. Two projects have these cash flows at times 0, 1, 2:
| t = 0 | t = 1 | t = 2 | |
|---|---|---|---|
| A | -100 | 0 | 121 |
| B | -200 | 240 | 0 |
a. Find each project's NPV. b. Find each project's IRR. c. Which project (if any) should be chosen?
AI-written answer, not official. Check before relying on it.The workbook gives NPV -38.27 and -28.57, IRR 10% and 20%; I agree with all four.
a. NPV at 40%
Excel: =NPV(40%,C3:D3)+B3 (the first cash flow is outside NPV).
b. IRR
Set NPV to zero. For A, , so and . For B, , so . Excel: =IRR(B3:D3), =IRR(B4:D4).
c. Decision
AnswerNPV: A = -38.27, B = -28.57. IRR: A = 10%, B = 20%. Both NPVs are negative and both IRRs are below the 40% cost of capital, so reject both. If the projects are mutually exclusive and one must be taken, take B: higher NPV (less negative) and higher IRR.
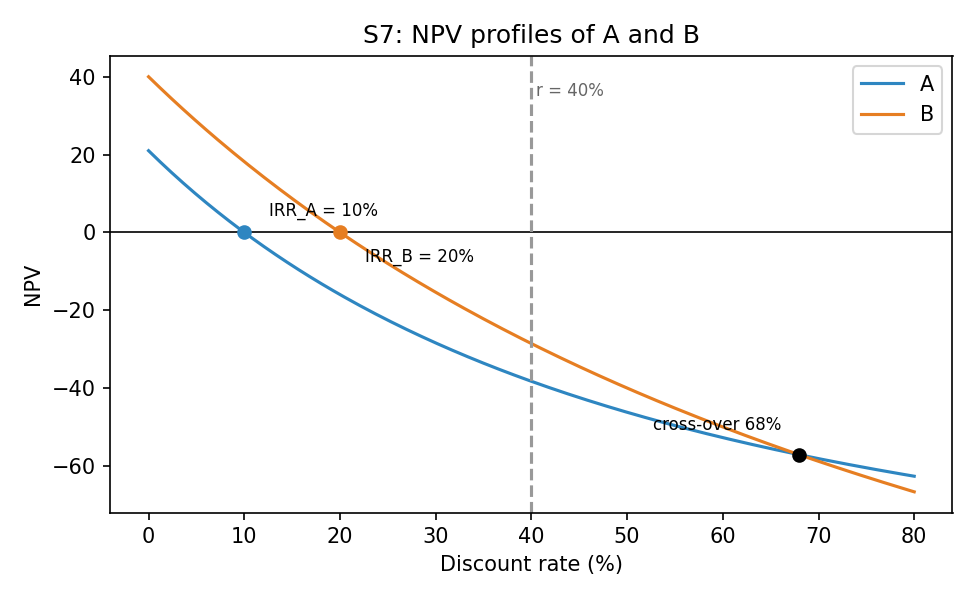
The NPV profiles cross at about 68% (solve for the difference A minus B, giving ). Below 68%, B has the higher NPV, so at 40% the NPV rule and the IRR rule agree on B.
IntuitionAt a 40% rate nothing here earns its keep: the best project returns only 20%. A pays off late (year 2), so a high discount rate hurts it more than B, which pays back after one year.
S10 — Two machines with different lives: NPV and EAC
Reconstructed question: the question paper is not on disk. This wording was inferred from the worked spreadsheet; check it against the real paper.
A firm can buy one of two machines. Each saves 40,000 a year in costs (taxable). The USA machine costs 100,000 and lasts 6 years; the China machine costs 60,000 and lasts 2 years. The tax rate is 25% and the discount rate is 12%. Compute each machine's NPV and equivalent annual value (EAC), and choose.
Input missing from sourceThe sheet depreciates both machines straight-line to zero over 2 years (cost divided by 2 in years 1 and 2), so the USA machine's tax life (2 years) is shorter than its economic life (6 years). The wording here is inferred from the formulas. Losses give an immediate tax saving.
AI-written answer, not official. Check before relying on it.The workbook gives NPV 44,467.86 and 3,376.91, EAC 10,815.73 and 1,998.11; I agree.
Free cash flow (EBIT = saving - depreciation; FCF = EBIT x 0.75 + depreciation):
| Year 0 | Years 1 and 2 | Years 3 to 6 | |
|---|---|---|---|
| USA: depreciation | 50,000 | 0 | |
| USA: EBIT | 40,000 - 50,000 = -10,000 | 40,000 | |
| USA: tax | +2,500 | -10,000 | |
| USA: NOPAT | -7,500 | 30,000 | |
| USA: FCF | -100,000 | 42,500 (-7,500 + 50,000) | 30,000 |
| Year 0 | Years 1 and 2 | |
|---|---|---|
| China: depreciation | 30,000 | |
| China: EBIT | 40,000 - 30,000 = 10,000 | |
| China: tax | -2,500 | |
| China: NOPAT | 7,500 | |
| China: FCF | -60,000 | 37,500 (7,500 + 30,000) |
NPV at 12% (Excel =NPV(12%,C17:H17)+B17 for USA, =NPV(12%,N17:O17)+M17 for China):
EAC (annuity-equivalent over each machine's life, from Lesson_03-Rate Conversion, Effective Rates & EAC):
Excel =-PMT(12%, n, NPV):
AnswerUSA: NPV 44,467.86, EAC 10,815.73 a year. China: NPV 3,376.91, EAC 1,998.11 a year. Choose the USA machine.
Because the lives differ (6 vs 2 years), compare equivalent annual values, not raw NPVs. Here both measures agree. Cross-check by repeating each machine over a common 12-year horizon: USA 66,996.66 vs China 12,377.06, the same ranking.
Sign conventionThe sheet uses
-PMTso that a positive NPV gives a positive annual figure. This is an equivalent annual benefit (the machines save costs), not a cost, so the larger number wins. For machines that are pure costs you would pick the smaller EAC.
Related Notes
- Lesson_06-Capital Budgeting & Free Cash Flow, HW_07-Free Cash Flow & Project NPV (Q1, S10)
- Lesson_02-Perpetuities, NPV & IRR, HW_02-NPV, IRR & Project Choice (S7)
- Lesson_03-Rate Conversion, Effective Rates & EAC, HW_03-Profitability Index & EAC, HW_04-Effective Interest Rates (S4, S10)
- Lesson_07-Bond Pricing, HW_08-Bond Pricing (S2)
- HW_09-Risk, Return & Diversification (Q2)
- Financial Management