
Lecture 1 — Introduction to Data Science
- #data-science
- #intro-data-science
- #lifecycle
- #python
- #google-colab
- #data-types
- #analytics
- #correlation
- #confounding
- #ethics
Lecture 1 — Introduction to Data Science
Part of: Data Science Previous: none | Next: Lecture 2 - EDA and Charts Key concepts: Data Science, Data Science Lifecycle, Exploratory Data Analysis, Data Types, Four Types of Analytics, Correlation vs Causation, Confounding Variable, Survivorship Bias, Data Ethics
The Core Idea
Data science = statistics + programming + domain knowledge, used to turn data into decisions. The course is aimed at future founders, managers and economists: you won't build production software, but you must be able to read data, ask the right questions, and spot bad analysis. The recurring theme: tools serve your thinking. The pipeline starts and ends with you.
Course logistics (skipped)Semester plan, grading (assignments 30%, quiz 20%, final project 50%) and office hours are logistics, not exam content. One policy matters: AI tools are allowed and encouraged for coding, but you must understand and be able to explain anything you submit.
Why Data Science? Four Company Stories
| Company | What happened | Lesson |
|---|---|---|
| Netflix | Used viewing history, pause/rewind patterns, searches and ratings, and A/B tested thumbnails and release timing | Won by knowing what each user wants to watch next, not just by content |
| Waze | Every phone is a live speed/location sensor | Routes computed from live data, not static maps |
| Quibi | Raised $1.75B, shut down about 6 months after launch | Never validated that the audience wanted the product |
| Slack | Started as the gaming company Tiny Speck; the internal chat tool had more usage than the game | Usage data revealed the real product |
The patternWinners collect data, analyse patterns, and decide on evidence rather than intuition alone. Quibi is the counter-example: a big budget with no validation.
Data literacy is a career differentiator: "the market is big" loses to "TAM is $4B, growing 23% YoY, our segment is underserved".
What the course will and won't do: you will learn to read and interpret data, ask the right questions, and use Python + pandas for basic analysis. You won't build production software, write complex algorithms, or need advanced maths.
What Is Data Science?
DefinitionData Science is an interdisciplinary field that uses statistics, programming and domain knowledge to extract actionable insights from data.
The three pillars
| Pillar | Contributes | Plain English |
|---|---|---|
| Statistics | Finding patterns in noisy data, quantifying uncertainty, testing hypotheses | Your bullshit detector: is the pattern real or random? |
| Programming | Automation, reproducibility (anyone can re-run it), scale (millions of rows) | Do in 3 seconds what takes 3 days by hand |
| Domain expertise | Knowing which questions matter | Your circle: a perfect model can predict the wrong thing |
Domain knowledge in actionKnowing that Q4 retail spikes are seasonal, not a sign of growth, is something a model won't tell you.
Data science vs related fields
| Field | Focus | Key tool | Output |
|---|---|---|---|
| Data Science | End-to-end insights | Python | Decisions |
| Statistics | Inference and testing | R / maths | P-values |
| Business Analytics | Dashboards and KPIs | Excel / Tableau | Reports |
| Machine Learning | Prediction algorithms | sklearn / TF | Models |
| AI | Autonomous systems | Deep learning | Agents |
Analogy: a data scientist is an investigative journalist: gather evidence (data), verify sources (clean), find the story (analyse), present it clearly (visualise). The audience is the CEO, investor or customer.
Data scientists sit cross-functionally next to decision-makers (product, marketing, finance, operations), not in a basement. Every data-producing industry hires them (finance, healthcare, retail, tech, government, logistics, marketing). The meta-insight: even if you never become one, you will hire one, manage one, or evaluate their work.
The Data Science Lifecycle
The pipeline is iterative, not linear: you loop back (e.g. EDA reveals dirty data, so you clean again).
| Stage | Tool | In the running example |
|---|---|---|
| Ask | your brain | "Is the revenue drop in one category?" |
| Collect | SQL, APIs | Orders, ads, traffic, support tickets |
| Clean | pandas | Fix dates, dupes, typos |
| Explore | pandas + matplotlib/seaborn | Electronics down 35%, shipping tickets spike |
| Model | scikit-learn | Not needed here |
| Communicate | matplotlib/seaborn, dashboards | Chart plus a one-liner |
| Decide | you | Switch shipping provider, discount codes |
Running example: the online storeYou co-found a Tel Aviv online store (electronics and home goods). Revenue is down 20% this month and an investor wants answers within a week.
1. Ask the right question
| Bad (vague / dramatic) | Good (specific, actionable) |
|---|---|
| "Why did revenue drop?" | "Did revenue drop equally across categories, or is it concentrated?" |
| "Is the company failing?" | "Did order volume drop, or did average order value drop?" |
Golden ruleA vague question guarantees a useless answer. Data scientists spend more time refining the question than building the model.
2. Collect data
Data lives in internal databases (orders, inventory), CRM systems, Google Analytics, payment processors, and more. The example pulls four datasets: order history, marketing spend per channel, website traffic logs, customer support tickets. Airbnb is the model case: every host and guest interaction (reviews, pricing, bookings, searches) is a data point feeding search ranking, dynamic pricing and trust signals.
3. Clean data
Typical "dirty data" problems: missing values, duplicates, typos, inconsistent date formats, impossible values.
| Before | After |
|---|---|
01/03/25 and March 1, 2025 mixed |
2025-03-01 standardised |
| Duplicate row (order 1001 twice) | Duplicates removed |
Quantity -3, city Tel Avvi |
Impossible value investigated, typo fixed |
Garbage in = garbage out, and the 80% ruleUp to 80% of a data scientist's time goes on collecting, cleaning and organising. Budget time and money for it; trust in your numbers is built here.
4. Explore (EDA)
Exploratory Data AnalysisEDA is summarising, visualising and investigating data before formal modelling. Analogy: the detective's crime-scene walkthrough, forming hypotheses. See Exploratory Data Analysis and Lecture 2 - EDA and Charts.
In the store example, summary statistics alone showed: electronics revenue -35%, home goods only -5%; average order value unchanged (so order volume fell); support tickets for electronics spiked (shipping delays).
Most questions don't need a modelWe answered "what happened" without building a single model.
5. Model
A model is a simplified map of reality (Google Maps is not the city, but navigable). It finds patterns in historical data to predict or quantify relationships.
| EDA is enough | A model is needed |
|---|---|
| "What happened?" (the revenue drop) | "What will happen next quarter?" (prediction) |
| "Which category is underperforming?" | "Which customers will churn?" (classification) |
6. Communicate
The best analysis is worthless if nobody understands it. A good chart has clear labels, is simple and annotated; a bad one is unlabelled, 3D and confusing. If your chart needs a 5-minute explanation, it's a bad chart. Investors read charts and one-liners, not code.
7. Decide and act
Example conclusion: a shipping provider failure hit electronics. Actions: switch to a backup provider, send 15% discount codes to affected customers, and set up automated alerts for delivery-delay spikes, then tell the investor "we found the root cause, here's our fix".
The Toolbox
| Tool | Role |
|---|---|
| Python | The language |
| Google Colab | The workspace (cloud notebook) |
| pandas | Data manipulation (rows and columns) |
| NumPy | Numerical computation |
| matplotlib / seaborn | Visualisation |
| scikit-learn | Machine learning |
- Why Python: readable (almost English), huge community, free, runs everywhere, libraries for everything.
- pandas analogy: if Excel is a bicycle, pandas is a motorcycle: same rows-and-columns idea, but millions of rows and everything automatable.
- matplotlib/seaborn chart-to-question map: bar = comparison, scatter = relationship, line = trend, heatmap = correlation.
- scikit-learn: give it historical data, it learns the pattern, you ask it to predict ("a crystal ball that shows its math").
- Not used: R (Python covers it), MATLAB (engineering, costly), SAS (legacy), Tableau (we build charts in code).
Tools map onto the pipelineAsk (you) → Collect (SQL, APIs) → Clean (pandas) → Explore (pandas + matplotlib/seaborn) → Model (pandas + scikit-learn) → Communicate (matplotlib/seaborn) → Decide (you again).
Google Colab
DefinitionGoogle Colab is a free, cloud-based Jupyter notebook environment that runs Python in the browser with zero installation. "Google Docs for code."
- Why: free, no installation, GPU available, saves to Google Drive, "works on everyone's machine".
- Anatomy of a notebook: text cells (your reasoning) and code cells (calculations) with an output area beneath. A good notebook reads like a report with embedded evidence.
- Features: run a cell with Play or
Shift+Enter; drag-and-drop uploads in the sidebar; mount Google Drive; share like a Google Doc. - Gotchas: runtime disconnects after about 90 minutes of inactivity (save often); cells must run in order (skip cell 3 and cell 4 may break); free-tier limits are fine for this course.
Your first Colab momentOpen colab.research.google.com, new notebook, type
2 + 2, pressShift+Enter: you just ran Python.
How it fits the course: every recitation and assignment is a Jupyter notebook you upload to Colab. You submit by running all cells and downloading the notebook as .ipynb.
Python in 10 Minutes
Only the grammar needed to read code in the first half of the course.
# Variables and the four basic types
name = "Startup X"      # str   - text
revenue = 45000         # int   - whole number
growth_rate = 0.23      # float - decimal
is_profitable = True    # bool  - yes/no
A variable is a labelled box: revenue = 45000 puts 45,000 in a box called revenue.
# Lists: a column of values (indexing starts at 0)
monthly_revenue = [12, 15, 14, 18, 45, 16]
monthly_revenue[0]        # 12  (first item)
monthly_revenue[-1]       # 16  (last item)
len(monthly_revenue)      # 6   (how many)

monthly_revenue.append(20)   # add a month
sum(monthly_revenue)         # total
max(monthly_revenue)         # best month
# Dictionaries: a labelled row (each value has a column name)
startup = {"name": "Wolt", "revenue": 50000, "city": "Tel Aviv"}
startup["revenue"]        # 50000
A pandas DataFrame is essentially a list of dictionaries.
# If / else: a decision rule
if revenue > expenses:
    print("Profitable!")
else:
    print("Burning cash")

# For loop: do this for every item
for month in monthly_revenue:
    print(month)

# Accumulator pattern: build a total step by step
total = 0
for month in monthly_revenue:
    total = total + month
print(total)              # same as sum(monthly_revenue)
Reconstructed from the slidesThe slide shows
print(total)giving120for the original six-item list. I did not re-derive it;12+15+14+18+45+16 = 120checks out (beforeappend(20)).
# Functions: reusable recipes
def average(numbers):
    return sum(numbers) / len(numbers)

average(monthly_revenue)  # 20.0 on the six-item list

# Imports: hire a specialist; "as pd" is a nickname
import pandas as pd
import numpy as np
import matplotlib.pyplot as plt
You rarely write functions in this course but you will call hundreds: pandas and sklearn are libraries of pre-made functions. Not covered: classes, try/except, file I/O, decorators.
| Concept | Example | Plain English |
|---|---|---|
| Variable | x = 5 |
Store a value |
| List | [1, 2, 3] |
A column of values |
| Dict | {"a": 1} |
A labelled row |
| If/Else | if x > 0: |
Make a decision |
| For loop | for i in list: |
Repeat for every item |
| Function | def f(x): return x+1 |
A reusable recipe |
| Import | import pandas as pd |
Hire a specialist |
Using AI for Coding
AI coding assistants (Claude, ChatGPT, GitHub Copilot, Gemini) generate, explain and debug code from natural-language descriptions.
Mental modelTreat AI as a junior developer you just hired: fast, knows syntax, never tires, but needs clear instructions and you must review its work before shipping.
Prompting formula: Context (columns, types, source) + Task (filter, group, visualise, predict) + Output (chart, table, number, explanation).
| Bad prompt | Good prompt |
|---|---|
| "write pandas code" | "I have a CSV with columns date, revenue, region. Group by region, compute average monthly revenue, show a bar chart." |
Workflow: describe → AI generates code → paste into Colab and run → read the output, does it make sense? → if wrong, describe what's wrong and repeat. This is how professionals work too.
| AI is good at | AI is bad at |
|---|---|
| Correct syntax, boilerplate, "how do I do X in pandas", charts from a description, explaining error messages, pseudocode to code | Your business context, judging whether output makes sense, choosing which analysis to run, interpreting results, catching logic errors |
Confident nonsenseAI can produce confident-sounding wrong answers. Your business vocabulary is your prompt-engineering skill; the future is "people who can direct AI effectively", not "people who code vs don't".
Types of Data
Why it mattersApplying the wrong method to the wrong data type gives garbage ("diesel in a petrol car"). The type decides which statistics and charts you may use.
Data
├── Quantitative (numbers)
│   ├── Continuous (any value in a range)
│   └── Discrete (countable whole numbers)
└── Categorical (labels / groups)
    ├── Nominal (no order)
    └── Ordinal (natural order)
| Quantitative | Categorical | |
|---|---|---|
| Subtypes | Continuous, discrete | Nominal, ordinal |
| Examples | Revenue $34,521.17, temperature 22.3C, time 3.5h (continuous); customers 150, clicks 2,340, stock 87 (discrete) | Country, product category, payment method (nominal); satisfaction 1-5, education level, company size S/M/L (ordinal) |
| Operations | mean, sum, std | mode, count, frequency |
| Charts | histogram, scatter | bar chart, pie chart |
Star ratings are trickyA 1-5 rating is technically ordinal (categorical) though people treat it as numeric. Know the trade-off.
Structured vs unstructured:
| Structured | Unstructured |
|---|---|
| Rows and columns: spreadsheets, databases, CSV | No predefined format: emails, images, tweets, audio, PDFs |
Most of the world's data is unstructured; extracting value from it is where modern data science earns its premium (see Lecture 7 for NLP and image analysis).
The cardinal sinOperations must match the data type. Averaging zip codes is meaningless, multiplying star ratings is dubious, and sorting countries alphabetically is not a ranking.
Your First Look at Real Data
An 8-week food delivery startup dataset (Tel Aviv):
| Week | Orders | Ad spend | Avg temp (C) | Revenue | Rating |
|---|---|---|---|---|---|
| 1 | 320 | 5,000 | 18 | 28,000 | 4.2 |
| 2 | 340 | 5,500 | 20 | 30,500 | 4.1 |
| 3 | 310 | 4,800 | 22 | 27,200 | 4.3 |
| 4 | 380 | 7,000 | 28 | 35,000 | 4.0 |
| 5 | 420 | 8,000 | 32 | 41,000 | 3.8 |
| 6 | 450 | 8,500 | 35 | 44,500 | 3.7 |
| 7 | 400 | 7,500 | 30 | 38,000 | 3.9 |
| 8 | 360 | 6,000 | 25 | 33,000 | 4.1 |
Column types: Week, Orders = discrete quantitative; Ad spend, Temp, Revenue = continuous quantitative; Rating = ordinal treated as numeric.
Descriptive statistics
| Stat | Orders | Ad spend | Temp | Revenue | Rating |
|---|---|---|---|---|---|
| Mean | 372.5 | 6,538 | 26.3 | 34,650 | 4.01 |
| Median | 370 | 6,500 | 26.5 | 34,000 | 4.05 |
| Min | 310 | 4,800 | 18 | 27,200 | 3.7 |
| Max | 450 | 8,500 | 35 | 44,500 | 4.3 |
When mean and median are close, the data is roughly symmetric with no extreme outliers pulling it sideways. (Mean = average; median = middle value once sorted.)
# Not on the slides: how you would get this table in pandas
import pandas as pd

weekly = pd.DataFrame({
    "week":     [1, 2, 3, 4, 5, 6, 7, 8],
    "orders":   [320, 340, 310, 380, 420, 450, 400, 360],
    "ad_spend": [5000, 5500, 4800, 7000, 8000, 8500, 7500, 6000],
    "temp_c":   [18, 20, 22, 28, 32, 35, 30, 25],
    "revenue":  [28000, 30500, 27200, 35000, 41000, 44500, 38000, 33000],
    "rating":   [4.2, 4.1, 4.3, 4.0, 3.8, 3.7, 3.9, 4.1],
})
weekly.describe()                   # count, mean, std, min, quartiles, max
weekly[["ad_spend", "revenue"]].corr()   # correlation matrix
Revenue over time
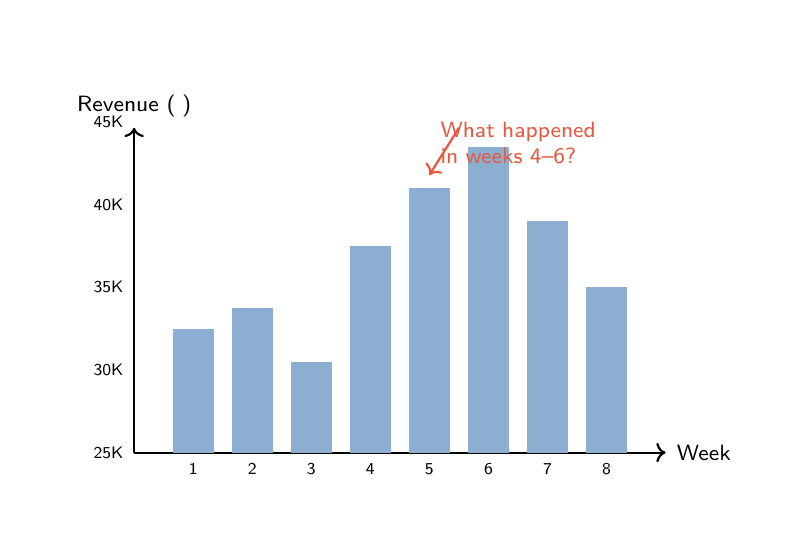
Revenue peaks in weeks 4 to 6 (the slide asks "what happened?"). The next step is to find out why.
Ad spend vs revenue
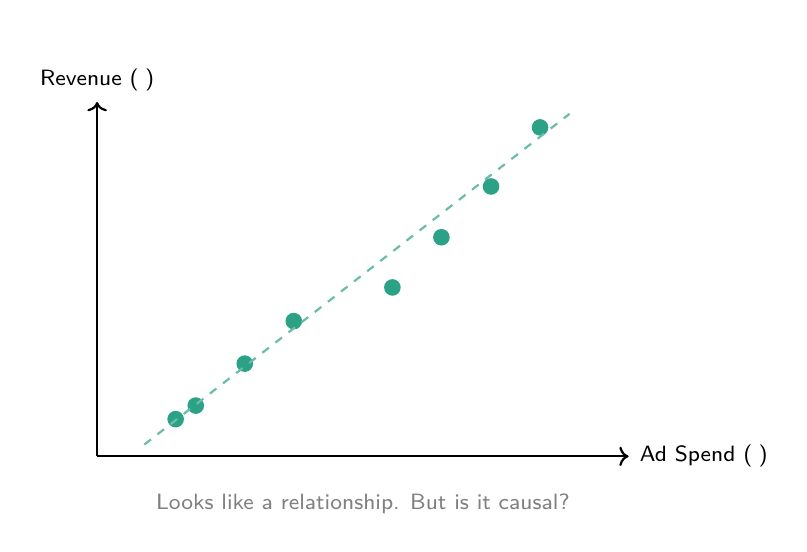
A tight upward line: a clear relationship. But is it causal?
Correlation is not causation
Correlation does not imply causationDoes more ad spend cause more revenue? The hidden variable is temperature: hotter weeks bring more delivery orders and the company raises ad spend in summer. Temperature is pulling both strings.
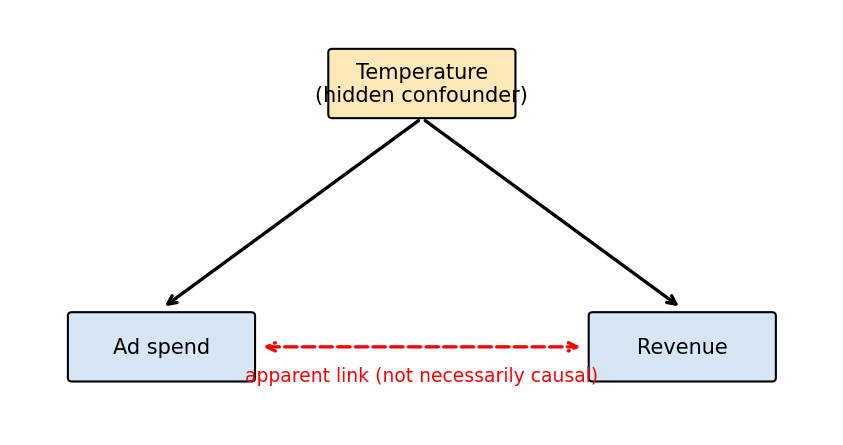
My own check (not on the slides)Computing Pearson correlations from the table above gives ad spend vs revenue about 0.99 and temperature vs revenue about 0.96, so the temperature story is consistent with the data. Eight points can't prove it, which is the point of the lecture.
The rating puzzle
Revenue up, rating down (week 6: 44,500 and 3.7; week 3: 27,200 and 4.3). Reading: higher volume, longer delivery, lower satisfaction. Growth without quality is a ticking time bomb, so look at all metrics together, not just revenue. As CEO you'd ask: "What's our plan for maintaining delivery speed during peak weeks?" Data gave you the question.
Thinking Like a Data Scientist
The four types of analytics
| Type | Question | Example | Note |
|---|---|---|---|
| Descriptive | What happened? | Quarterly sales, traffic, conversion dashboards | Most common |
| Diagnostic | Why did it happen? | Drill down: which region, which product, what changed | The store investigation |
| Predictive | What will happen? | Forecast Q1 revenue from 12 months; weather forecasting | |
| Prescriptive | What should we do? | Optimal price to maximise profit | Most advanced, most valuable |
The analytics staircase: value and difficulty increase from descriptive to prescriptive. You can't prescribe without predicting, predict without diagnosing, or diagnose without describing.
Case studies
- Spotify Wrapped is pure descriptive analytics (top songs, minutes, genres), yet over 200 million people engage and tens of millions share it voluntarily: huge free marketing. Sometimes the simplest analysis is the most valuable.
- Amazon recommendations ("customers who bought X also bought Y") are predictive, driving an estimated 35% of product sales. The algorithm isn't that complex; scale makes it powerful.
Confounding variables
DefinitionA confounding variable is a hidden third variable that influences both observed variables, creating a false impression of a direct relationship.
- Ice cream sales and drownings both rise in summer: hot weather drives both.
- Umbrella sales and rainfall: weather again.
- Stores with more employees have higher revenue: store size drives both.
- Countries with more Nobel laureates eat more chocolate: wealth (education and luxuries).
HabitEvery time you see a correlation, ask: "What's the hidden third variable?"
Survivorship bias
You only see the survivorsYou see only startups that succeeded; the data you don't have matters as much as what you do. Classic example: WW2 planes. The military wanted to reinforce the parts with bullet holes; statistician Abraham Wald said to reinforce the parts without holes, because planes hit there never returned.
Ethics and Responsibility
As a future leader these decisions land on your desk, not the engineer's.
| Case / topic | What happened | Lesson |
|---|---|---|
| Amazon hiring algorithm | Trained on 10 years of mostly male hires, it penalised resumes containing "women's"; scrapped | Bias in = bias out: the data was biased, not the algorithm |
| Cambridge Analytica | Facebook data of millions harvested without consent for political targeting; $5B FTC fine for Facebook's wider privacy violations | Data is powerful; misusing it destroys companies |
| Explainability | A model that works but can't be explained is a liability; the EU AI Act requires explanations for high-risk automated decisions | Regulators, investors and customers demand it |
Privacy basics: consent (users agree), purpose limitation (use only for stated purposes), data minimisation (collect only what you need), right to deletion. Key laws: GDPR (EU) and Israel's Protection of Privacy Law 1981. The question is not only "what can we collect" but "what should we collect".
Questions a CEO owns: What data may we collect? Is the model fair across demographics? Can we explain automated decisions? What if data leaks?
Hands-On Exercises (from the lecture)
Exercise 1: classify each metric (type, and structured/unstructured).
| # | Metric | Type | Format |
|---|---|---|---|
| 1 | Monthly revenue | Quantitative (continuous) | Structured |
| 2 | Complaint email text | Text | Unstructured |
| 3 | App downloads | Quantitative (discrete) | Structured |
| 4 | Product category | Categorical (nominal) | Structured |
| 5 | NPS score (0-10) | Categorical (ordinal) | Structured |
| 6 | Instagram photo | Image | Unstructured |
| 7 | Employee ID | Categorical (nominal) | Structured |
| 8 | Company size | Categorical (ordinal) | Structured |
| 9 | GPS coordinates | Quantitative (continuous) | Structured |
| 10 | Satisfaction (Happy/Neutral/Unhappy) | Categorical (ordinal) | Structured |
Trick questionEmployee ID is a number but is categorical: you can't average IDs. The slide calls this the most common trick question in data science.
Exercise 2: spot the dirty data (a 5-row customer table). Problems found: missing email (Dan Levy), impossible age of -3, duplicate row (ID 101 twice), typo "Tel Avvi", revenue stored as the string "N/A", and a date in the City column. On a million rows this is why cleaning takes most of the time.
Exercise 3: the CEO's question. Marketing says "double the ad budget, look at the correlation with revenue!" Three good questions: (1) is it causal, or is temperature driving both? (2) what happened to ratings in high-revenue weeks, can we handle the volume? (3) what is the ROI per extra shekel, linear or diminishing? A good CEO doesn't reject data, they interrogate it.
Exercise 4: match the analytics type. Q2 revenue was 2.3M, up 12% = descriptive; revenue dropped because the top sales rep quit = diagnostic; Q3 will be about 2.6M = predictive; hire 2 reps and raise ads 20% to hit 3M = prescriptive.
Summary
- Data science = statistics + programming + domain expertise, used to make evidence-based decisions.
- The lifecycle is Ask, Collect, Clean, Explore, Model, Communicate, Decide, and it is iterative. Cleaning takes up to 80% of the time; EDA alone answers most business questions.
- Toolbox: Python, Colab, pandas, NumPy, matplotlib/seaborn, scikit-learn. AI assistants are encouraged, but review and understand everything.
- Data types: quantitative (continuous, discrete) vs categorical (nominal, ordinal); structured vs unstructured. Operations must match type.
- Four analytics types: descriptive, diagnostic, predictive, prescriptive.
- Traps: correlation is not causation (look for confounders), survivorship bias, biased historical data.
- Ethics: consent, purpose limitation, minimisation, deletion, explainability.
One-linerThe most expensive model is useless if you asked the wrong question.
Key terms
| Term | Definition |
|---|---|
| Data Science | Interdisciplinary field: statistics + code + domain expertise |
| EDA | Investigating data before modelling |
| Quantitative | Numeric data (continuous or discrete) |
| Categorical | Labels or groups (nominal or ordinal) |
| Correlation | Two variables move together (not necessarily causation) |
| Confounding variable | Hidden factor creating a false apparent relationship |
Related notes
- Data Science (course hub)
- Lecture 2 - EDA and Charts: next, a deep dive into EDA and visualisation
- Exploratory Data Analysis, DataFrame
- Recitation 1 (Python and NumPy/pandas practice), as flagged on the closing slide