
PS3
- #data-science
- #intro-data-science
- #clustering
- #k-means
- #elbow-method
- #silhouette-score
- #pca
- #customer-segmentation
- #feature-scaling
- #unsupervised-learning
Toolkit
- 1
Load the Mall customers dataset (200 rows) and explore it. The
Gendercolumn stays in the DataFrame for profiling later, but is not used as a clustering feature: K-Means uses Euclidean Distance, which does not work meaningfully on categorical variables, and one-hot encoding a single binary feature adds little at this scale. Hint:kagglehub.dataset_download(...), datasetvjchoudhary7/customer-segmentation-tutorial-in-python, fileMall_Customers.csv. After loading, dropCustomerID(it is just a row number). - 2a
Explore the data visually before clustering. Look for natural groupings.
(a) Plot histograms of the three numeric features in one row.
- 2b
(b) Scatter plot of Income vs Spending Score.
- 2c
(c) Conceptual: can you visually spot natural groupings? Roughly how many? Describe in 2 to 3 sentences.
- 3
Select the 3 numeric columns for clustering and scale them with
StandardScaler; convert the result back to a DataFrame. Conceptual: why is scaling mandatory before K-Means? What would happen if Annual Income (in thousands), Spending Score (1 to 100) and Age (18 to 70) stayed on their original scales? Which feature would dominate and why? (2 to 3 sentences.) - 4
Run K-Means with (
KMeans(n_clusters=3, random_state=42, n_init=10)) and store the labels in a new column ofdf_mall. The notebook then plots a 2D Income vs Spending scatter coloured by cluster, noting that the Age dimension is not shown. - 5
was a guess. Loop over to , run K-Means for each (
random_state=42,n_init=10) and save.inertia_. Plot inertia (within-cluster sum of squares) against and look for the "elbow" where adding clusters stops helping much. The notebook checks that you have 9 values and that inertia is monotonically decreasing. - 6
For each from 2 to 10 compute
silhouette_score(X_scaled, labels). Higher is better; the best has the highest silhouette. Assign it tobest_k. Conceptual: based on both the elbow plot and the silhouette scores, what do you recommend? Do the methods agree? If not, how do you decide? (2 to 3 sentences.) - 7
Run K-Means with the best (
n_clusters=best_k,random_state=42,n_init=10), assign the labels todf_mall['Cluster'], and plot the result with the cluster centres marked. - 8a
Numbers alone do not help marketing. (a) Profile each cluster with
groupby('Cluster')[...].mean()and cluster sizes. - 8b
(b) Show the gender breakdown per cluster, as counts and as proportions.
- 8c
(c) Conceptual: give each cluster a marketing-friendly name and one specific marketing action (1 to 2 sentences each). Also: are the clusters distributed similarly between male and female customers? What might that mean for marketing? (1 to 2 sentences.)
- 9
Fit
PCA(n_components=2)onX_scaledand read.explained_variance_ratio_. Conceptual: how much of the total variance do the two components capture together? Is any important information lost? If KenionPlus had 15 behavioural features instead of 3, why would PCA become essential? (2 to 3 sentences.) The notebook checks the total is between 0.5 and 1.0. - 10
Project the data into PCA space with
pca.transform(X_scaled)and scatter plot it coloured by the Q7 cluster labels. Conceptual: compare this to the Income-vs-Spending plot from Q7. Do the clusters look cleaner or messier in the PCA view? Why? What did PCA incorporate that the original 2D plot missed? (2 to 3 sentences.) - 11
Compare the supervised (regression) and unsupervised (clustering) approaches. (a) What is the fundamental difference, and when do you use each? (b) Regression has R-squared; in clustering there is no R-squared, so how did you evaluate whether the clusters were "good"? (c) Could you use clustering on the insurance dataset from the regression project? What might it reveal, and would it replace or complement a regression model? (4 to 6 sentences in total.)
- 12
Write a short summary paragraph for KenionPlus (5 to 8 sentences): how many customer segments did you find, describe them with your names, which segments are the biggest business opportunity, and what is your number-one marketing recommendation?
Related: Lecture 5 - Clustering and Dimensionality Reduction, Lecture 2 - EDA and Charts, Lecture 4 - Regression, Lecture 3 - Classification, KNN, Random Tree
SourceQuestions: HW3, Clustering & Dimensionality Reduction (Spring 2026), notebook
alfie.rees_hw3.ipynb. The worked solution is Alfie's own submitted answers, not an official answer key. The notebook was saved without any cell outputs, so no numeric result (cluster sizes, silhouette values, variance ratios) is quoted below unless Alfie wrote it in his own answer. Where a result is only claimed in his prose, it is marked as his claim.
What This Problem Set Is About
A retail chain with shopping malls has 200 loyalty-card holders and asks: who are our customer types, and how should we market to each? There is no target variable, so this is Unsupervised Learning: the algorithm finds structure and you give it meaning.
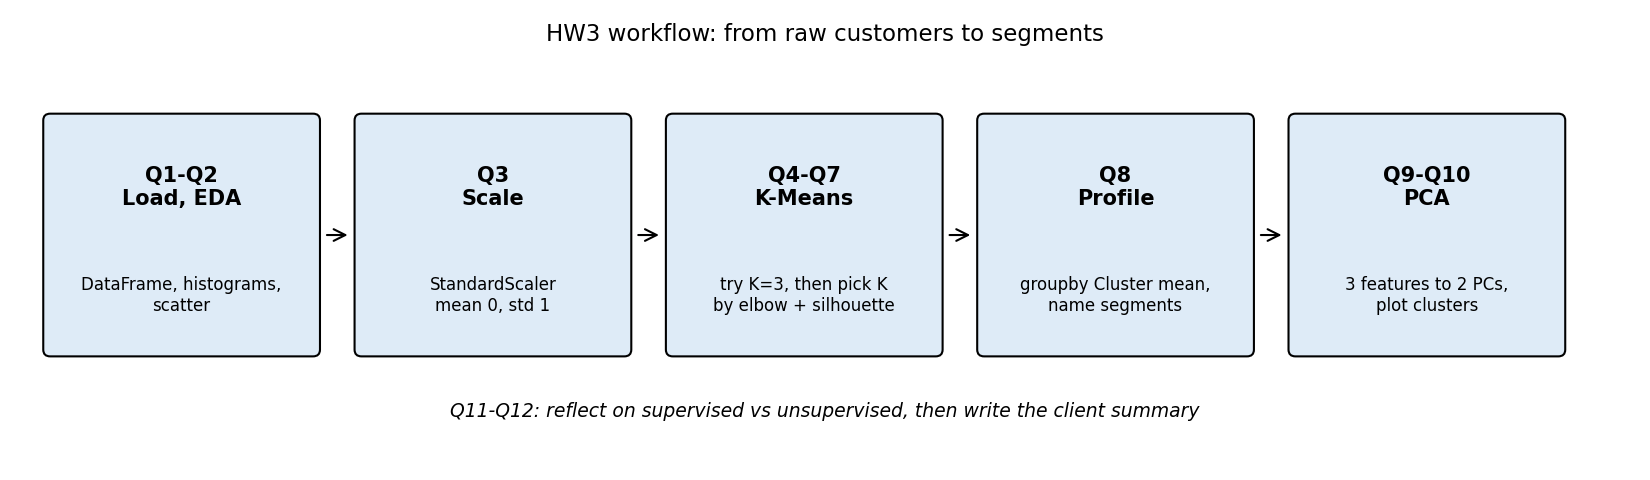
The recipe
- Explore the data and look for visible groups (Q1, Q2).
- Scale the features, because K-Means is distance based (Q3).
- Cluster with K-Means, first with a guess of , then with a chosen by the Elbow Method and Silhouette Score (Q4 to Q7).
- Profile each cluster in business terms (Q8).
- Compress with PCA to get an honest 2D picture of all three features (Q9, Q10).
- Reflect and write the client summary (Q11, Q12).
Setup cell (given, not to be modified):
import pandas as pd
import numpy as np
import matplotlib.pyplot as plt
import seaborn as sns
import kagglehub
import os
from sklearn.preprocessing import StandardScaler
from sklearn.cluster import KMeans
from sklearn.metrics import silhouette_score
from sklearn.decomposition import PCA
Grading split: Part A (Q1 to Q8, clustering) 65 percent, Part B (Q9 to Q12, PCA and reflection) 35 percent.
Part B: PCA, Reflection and Synthesis
In Q4 and Q7 the 2D scatter shows Income and Spending, but the clustering used three features. PCA compresses all three into two new axes that capture as much of the variance as possible, giving an honest 2D picture.
Quick Revision Checklist
- Why scale before K-Means and PCA? (distance and variance are unit-dependent)
- Exclude
Genderfrom K-Means (categorical, Euclidean distance) - Elbow uses
.inertia_(fromfit); silhouette needs labels (fromfit_predict) and starts at - Centroids from
cluster_centers_are in scaled units:inverse_transformbefore plotting - Cluster labels are arbitrary: profile with
groupby('Cluster').mean()to name them - PCA on 3 standardised features keeps at least of variance with 2 components
- Clustering complements regression (segments, feature engineering), it does not replace it